Your North York bungalow’s tear-down value equals comparable land prices minus demolition costs—currently $52 per buildable square foot in Q2 2025, down 38% from peak. Calculate by multiplying your lot’s buildable area by local per-foot rates, then subtract $15-$25 per square foot for demolition. Properties within 500 meters of subway stations command premiums due to provincial density rules allowing 20-30 storey development. Renovation permits now reach $1 million, fundamentally shifting the hold-versus-sell equation through specific zoning considerations and developer acquisition patterns.
Key Takeaways
- Land values in North York dropped 38% from peak, averaging $52 per buildable square foot in Q2 2025.
- Calculate tear-down value using comparable vacant land sales minus demolition costs, not assessed property values.
- Development potential determines buyer pricing; subway proximity enables 20-30 storey builds with Floor Space Index ratios of 6.0.
- Zoning-approved sites sold for $204 per buildable square foot, nearly double properties requiring rezoning in 2025.
- Renovation permits now reach $1M while transaction volumes crashed from $1.6 billion to $400 million quarterly.
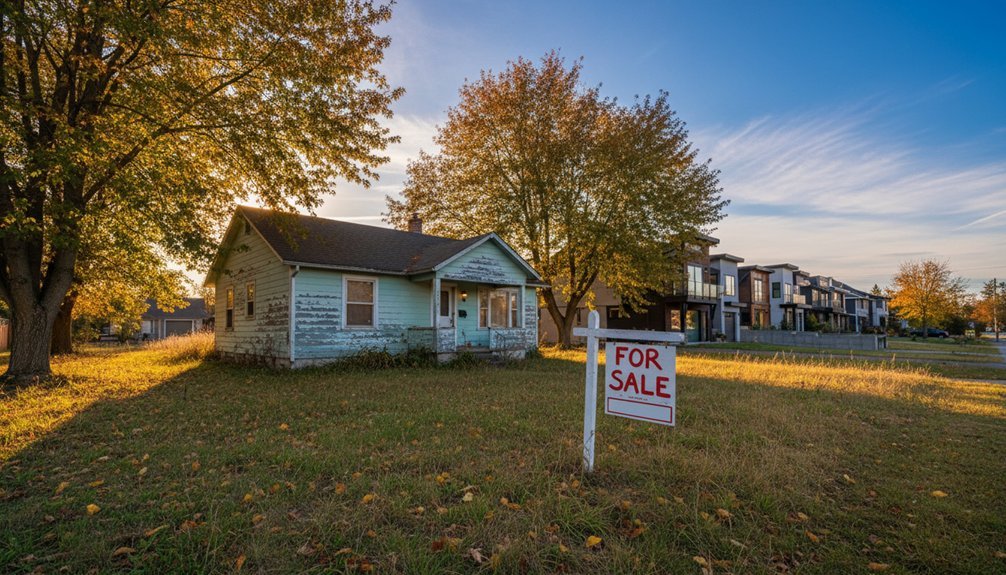
Should You Sell Your North York Bungalow for Land Value or Renovate?
North York bungalow owners face a critical decision in early 2025: sell for land value or invest in renovations.
With land values down 38% from peak and renovation permits reaching $1M, the math on holding versus selling has fundamentally shifted.
Current Land Values:
- Suburban Toronto properties average $37 per buildable square foot
- Values dropped 29% year-over-year, 38% from peak
- 36% of Toronto Q2 transactions fell below $60 per buildable square foot
Renovation Investment Range:
- Deck permits valued at $60,000
- New building permits reached $100,000 to $1M
- Demolition permits actively issued in North York
Market Considerations:
Your median sale price sits at $800,000 based on December 2025 data. Most properties sold between $500K-$750K. Single-family detached homes averaged $1,150,200, down 6.3% year-over-year. Understanding market trends and fluctuations helps clarify whether your property’s value leans toward renovation potential or pure land worth.
Rental Alternative:
North York rentals command $2,501 monthly. Projections show flat rates through 2026, then 7% growth by 2028. Double-digit increases expected 2029-2030. Developers now favor smaller rental projects with faster approvals and more manageable absorption rates.
The numbers reveal renovation costs compete directly with declining land values.
How to Calculate Your Property’s Tear-Down Value
When calculating tear-down value, you’re measuring pure land worth minus demolition expenses.
Start with comparable vacant land sales in North York. Adjust for lot size differences using the sales comparison method. If vacant lots aren’t available, use the extraction method—subtract improvement values from total property sales.
Next, estimate demolition costs. Measure your bungalow’s gross external floor area during inspection. Sketch the floor plan outline for accuracy. Multiply square footage by per-foot demolition rates from local contractors.
The formula is straightforward: Land Value – Demolition Cost = Tear-Down Value.
For example, if comparable vacant lots sell for $1.2M and demolition runs $50,000, your tear-down value sits at $1.15M. This approach is less reliant on active market conditions than traditional appraisal methods since land values tend to remain more stable.
Avoid using assessed land values—they’re mass appraisal estimates, not market-driven. The structure adds zero contributory value here. Buyers purchasing tear-downs want clean land, making demolition costs a necessary deduction from gross land worth. Keep in mind that larger lots may actually sell for a lower price per square foot than smaller properties in the area.
North York Land Values: 2025 vs. the 2021 Peak
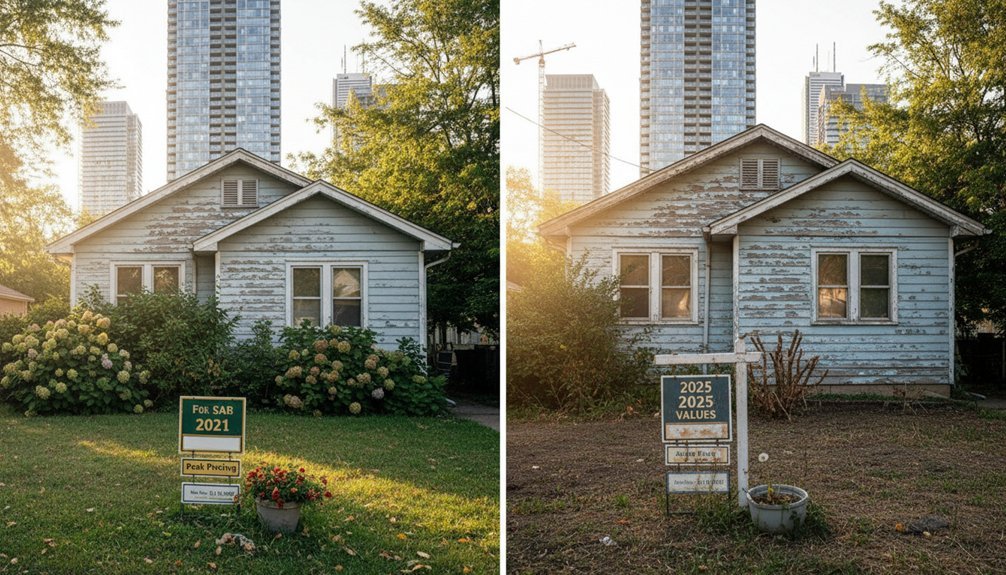
Since 2021’s market peak, high-density land values across the GTA have collapsed by 43%. North York’s tear-down bungalows sit directly in this market correction.
What the numbers reveal:
- Q2 2025 land prices averaged $52 per buildable square foot
- Based on just 15 sales—lowest quarterly count since 2017
- Transaction volumes crashed from $1.6 billion (Q2 2022) to $400 million (Q2 2025)
- Zoning-approved parcels no longer command historical premiums
Current market reality:
Your property’s land component reflects these diminished values. High holding costs and restrictive financing drove investors away. Mid-2024 showed brief recovery attempts, then declined further. Competing land uses, including solar and energy development, further complicate valuation expectations for urban parcels.
Residential prices tell part of the story:
- GTA benchmark: $942,300 (December 2025), down 6.3% year-over-year
- Toronto median: $780,000, down 6.0%
- Active listings increased 3.6%
Industry insiders suggest published data understates actual deterioration. The oversupplied apartment sector adds downward pressure through 2025. Meanwhile, many farm landowners in rural markets continue holding their properties rather than selling, creating a contrasting dynamic to urban inventory increases.
How Zoning and Density Rules Affect Your Lot Price
Your lot’s development potential—not the house itself—determines what builders will pay. Within 500m of a subway station, provincial rules let developers build up to 20 or 30 storeys with Floor Space Index ratios reaching 6.0, dramatically inflating land values compared to single-family zones. A corner lot near Finch Station commands premiums because 100% lot coverage and mid-rise zoning translate to more sellable square footage than an interior parcel restricted to lower densities. Developers also value properties with older commercial or institutional buildings, since residential conversion programs can unlock additional housing units without demolishing existing structures, potentially offering faster approval timelines and cost savings. Properties on underused commercial corridors are particularly attractive to developers because zoning reforms increasingly allow multifamily buildings in these locations, creating higher-value redevelopment opportunities than traditional residential lots.
Mid-Rise Versus High-Rise Premiums
How much developers pay for your North York bungalow depends heavily on whether they’re planning a mid-rise or high-rise project. Mid-rise sites commanded $124 per buildable square foot in Q1 2022. High-rise sites fetched only $116 per buildable square foot—sometimes as low as $108.
Why the premium for mid-rise?
Developers prefer lower-risk projects. Mid-rise buildings offer faster approvals and shorter sales absorption periods. High-rise projects carry additional floors and greater gross floor area, increasing financial exposure.
By 2025, Toronto’s mid-rise land averaged $132 per buildable square foot over 2.5 years. High-rise land dropped to just $91 per buildable square foot in the same timeframe.
Your lot’s maximum allowable density directly determines which developer type you’ll attract—and what price they’ll pay. Sites with zoning already approved sold for $204 per buildable square foot—nearly double the price of properties requiring rezoning applications. Land purchasers in North York typically paid about 9% of estimated revenue for their sites, reflecting the impact of rising construction costs on developer calculations.
Zoning Approval Price Impact
Current North York Centre zoning updates reshape land values dramatically:
- Within 200m of stations: Your lot qualifies for 6-storey residential construction along Major Streets in Neighbourhoods-designated areas.
- Beyond 200m: Maximum height drops to 4 storeys, slashing developer interest and pricing accordingly.
- Large assemblies: Sites fitting three or more towers access 6 FSI densities between 200m-500m under August 2025 provincial approvals.
Distance dictates value. A 50-meter proximity difference translates to 30-40% price variations. Provincial MTSA amendments override municipal restrictions, making ministerial approvals final and unappealable.
Buildable Square Footage Calculations
Zoning regulations determine your maximum buildable square footage, but that number doesn’t equal usable space. Your 9,000-square-foot North York lot faces a 35% coverage limit—just 3,150 buildable square feet. Setbacks consume additional area:
- Front yard: varies by zone classification
- Side yards: 1.8m each (5.9 feet) minimum
- Rear yard: affects extension calculations
Height restrictions cap buildings at 3.7 meters in residential zones. That’s approximately 12.1 feet—barely one full storey.
Density calculations use lot area per bedroom ratios. Some districts require 5,000 square feet per bedroom, limiting your lot to one bedroom theoretically.
Buyers calculate net buildable area after subtracting all setbacks. A developer sees constrained potential. Your asking price must reflect these mathematical realities, not gross lot dimensions.
When Renovating Costs Less Than Selling for Demolition
What’s the actual cost difference between fixing up your bungalow and selling it as land?
A modest 1,200 sq. ft. bungalow renovation runs $120,000–$360,000 total. You’ll capture the highest returns by focusing on three specific areas:
- Kitchen renovation: $25,000–$40,000 basic, $40,000–$70,000 mid-range
- Bathroom updates: $10,000–$18,000 basic, $18,000–$30,000 mid-range
- Basement finishing: $30,000–$50,000 unfinished to finished
Your break-even calculation matters here. If renovation costs exceed $150,000 but only adds $100,000 to market value, you’re losing money versus land sale.
Only renovate when the added market value exceeds your total investment costs compared to selling as-is for land value.
Mid-range materials typically deliver better returns than high-end finishes in tear-down neighborhoods. Buyers purchasing in demolition-prone areas aren’t paying premiums for luxury upgrades.
Combining multiple rooms in one project reduces mobilization expenses. Labor and permit costs in 2026 continue rising. Strategic renovation works when final sale price minus renovation costs exceeds land-only offers.
What Developers Actually Pay for Bungalows Today
When developers assess your North York bungalow, they’re calculating backward from profit margins, not forward from your asking price.
The Developer’s Math:
- Final sale price of new build: $2.5–$3.5 million
- Construction costs: $275–$450 per square foot
- Demolition expense: $10,000–$30,000 depending on size
- Permit and professional fees: $50,000–$100,000
- Desired profit margin: 15–20% minimum
What This Means for Your Offer:
Your land value equals the final number after subtracting all costs. A 1,500 sq ft bungalow on a desirable lot might fetch $800,000–$1.2 million from developers, even if comparable renovated homes sell for $1.5 million.
Additional Deductions:
- Garage removal: $2,000–$9,000
- Pool demolition: $3,000–$20,000
- Hazardous material abatement: $25 per square foot
- Site preparation and grading costs
Developers aren’t being generous. They’re protecting their investment against Ontario’s volatile construction market.
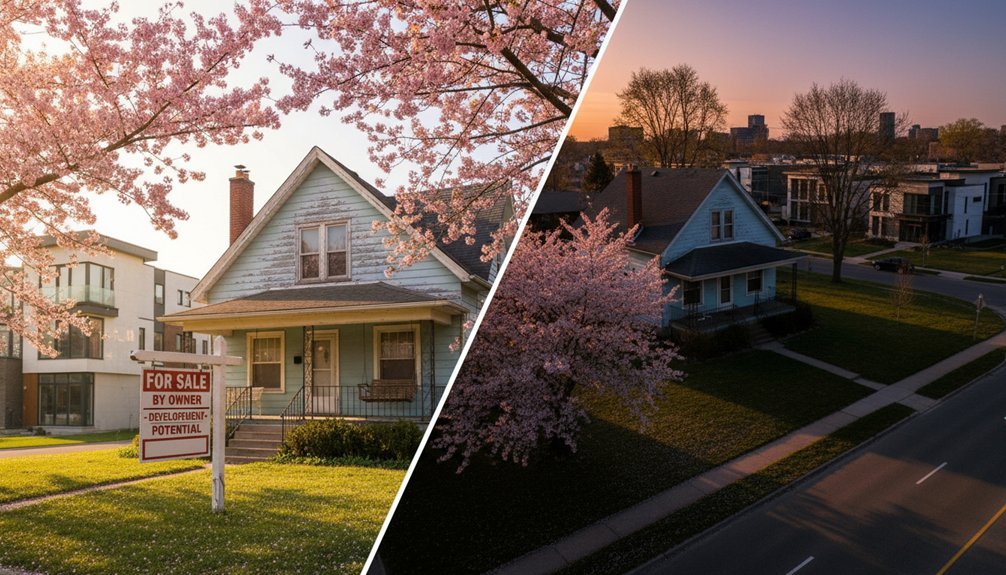
Should You Market to Developers or Family Buyers?
Your choice between targeting developers or family buyers fundamentally reshapes your pricing strategy, marketing timeline, and negotiation leverage.
Developers focus exclusively on land value in high-demand areas. They’ll demolish your structure for multiplex conversions or custom builds. North York bungalows convert to fourplexes with $200K investments, yielding 17% annual returns. Demolition costs run $10,000 to $30,000, with rebuilds at $275 to $450 per square foot.
Family buyers value preservation over replacement. They’re attracted to:
- Single-level living with original wood floors, fireplaces, and unique architectural details
- Spacious lots providing larger backyards than new builds in established neighborhoods
- Renovation potential for finishing basements (70% ROI) or adding second stories
Your marketing approach should balance both audiences. Highlight lot size for teardowns while showcasing charm and expansion possibilities for preservationists. Align with neighborhood expectations—overbuilding in modest areas kills ROI. Land appreciation often outpaces structure depreciation, making developer interest strong in Toronto’s established zones.
Best Months to List Your North York Bungalow in 2025
Timing your listing affects final sale price by 10% to 20% in Toronto’s seasonal market. Spring 2025 dominates North York’s bungalow sector.
Strategic spring timing can boost your North York bungalow sale price by up to 20% in developer-focused markets.
Prime Listing Windows:
February-April (Optimal)
- Developer activity peaks late winter in North York
- April 2024 recorded 7,025 GTA sales—highest monthly volume
- List early March to capture pre-May competition surge
- Buyers secure financing before spring inventory floods market
September-October (Secondary)
- Serious buyers return post-summer with reduced competition
- Lower inventory helps tear-down properties stand out
- Developers finalize year-end acquisitions before budget resets
Avoid December-January
- Showing requests drop 40%-60% during holiday season
- Snow obscures lot dimensions and property boundaries
- Developers pause acquisitions until Q1 budgets activate
North York’s developer-driven market follows citywide spring patterns but shows stronger late-winter activity. February listings capture motivated buyers before April’s crowded peak. Your bungalow’s land value remains constant, but buyer volume fluctuates dramatically by season.
Conclusion
You need your property’s current land value, total renovation costs, and realistic sale price post-renovation. Compare these against developer offers—typically 10-15% below market for tear-downs. Most North York bungalows make financial sense as renovations if structure remains sound. Run the numbers twice. Get three contractor quotes. List strategically in April or September. Your timeline matters more than market timing.